
There is one question that haunts every experienced marketing executive as it relates to spending money on demand generation: what is the optimal mix of demand gen marketing campaigns and if we have extra money to spend, where should we spend it and why? Lots of advanced marketing tools are available and new ones are released all the time. But none that I’ve seen exactly answer these questions and the reason is because optimizing your mix demand generation activities is just as difficult as optimizing your mix of personal investments (ie – stocks, bonds, real estate, CD’s, etc). So why not steal a concept from the investing world and apply it to marketing? I’m talking about Portfolio Theory.
What is portfolio theory?
If your personal financial investments are like many, you have money invested in various different asset classes. Why do you do this? Why not just invest all of your money in the thing that is predicted to bring you the highest return? The answer is because there other factors at play, namely risk and volatility. The investment opportunities that offer the highest possible return are also the ones that have a risk of going down the most. There’s also the hot-cold-hot-cold aspect of investments that carry high volatility. Over time they might provide a nice return but you have to be willing to ride the roller coaster along the way.
Because of these issues, instead most people choose to put some money in high-risk/high-reward investments, other money in safe/secure investments, some money in US large cap companies and other money in emerging market companies – as an example. Of course the available choices are almost infinite and the associated continuum between the risk/reward extremes is wide. But that’s why you have an investment advisor to help you decide along the way. And what you’ve just implemented is considered “portfolio theory” in its most basic form.
What does all this have to do with marketing?
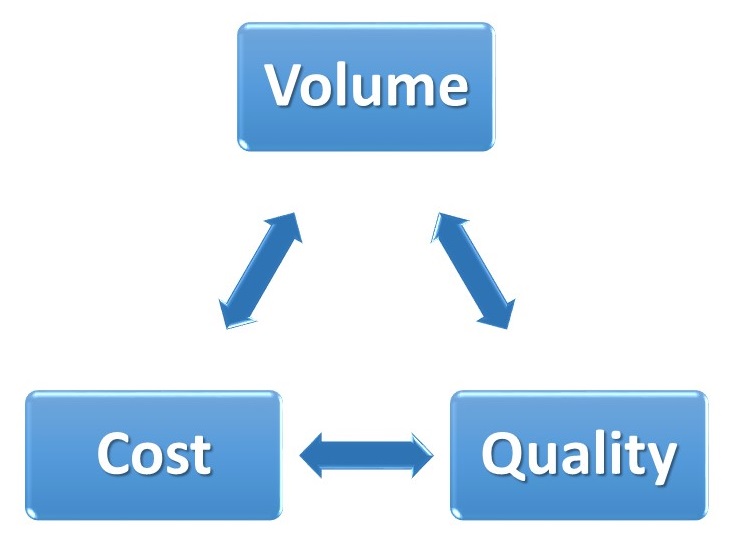
The various types of campaigns and programs that make up demand generation marketing are actually not much different and can leverage the same portfolio theory as described before. Instead of return, risk and volatility as the variables, we have the following:

 Volume – How many leads can be generated?
- Cost – What is the average cost per generated lead?
- Quality – Usually reflected in a conversion rate of some sort
If you have these three pieces of information for each major type of marketing campaign in your demand generation mix, you can visualize the results to get an unbelievable assessment of your portfolio. See an example below. In this case, I’ve chosen to use the X and Y axis for Cost and Quality respectively while using the size of the circle to reflect the Volume metric.
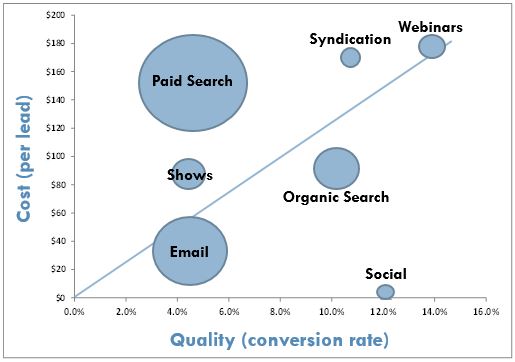
It is logical that the more you spend per lead the higher the quality should be. In other words, it seems logical that the results would fall along or near the diagonal line. What’s amazing is how often that’s not the case. The further a campaign shows above the diagonal line the less interesting it is from a portfolio optimization standpoint. There might be other reasons to continue doing those campaigns but just admit that it’s not to optimize your demand gen portfolio spend.
Using the graph above as an example, it appears that Paid Search isn’t providing an ideal cost/quality trade-off but it is producing the most volume. Could that volume be redirected to the more favorable Organic Search (lower cost and better quality)?
It’s also often the case that ideal campaigns (those that show below the diagonal line) aren’t able to produce high volumes of leads. In fact, many types of marketing campaigns don’t offer unlimited elasticity, which simply means that if you spend 100X you won’t get 100X the volume. Otherwise, you could simply take the campaigns that show far below the diagonal line (high quality for the amount spent) and spend a ton of money on them while dropping everything else. An example might be Organic Search. There are limits to how much money you can spend on search engine optimization (SEO) and going overboard on SEO-related activities can sometimes do more harm than good.
Additional insights to consider
- “Double Click” – The graph shown here includes marketing campaign categories. Imagine “double-clicking” on one specific category like social and seeing the differences between Facebook, Twitter, Instagram and TikTok. Or for something like events you could see the 5 different events you participated in over the last few months and how they compare against each other on the volume-cost-quality scale. Now that’s powerful.
- Analysis Paralysis – This concept can be so enlightening and powerful that you might drive your marketing team or freelancer crazy with requested iterations. Start at the highest level with your 3-5 different marketing campaign categories and decide which lead stage you want to plot (raw or qualified). Assemble and plot this basic high level view but stop there and simply foster a dialog of questions, theories and logical experiments to further optimize. Run those experiments and see how the portfolio picture changes. With increased maturity of tools and personnel, you can expand the analysis with additional functionality like the “double click” example described above.
- Raw versus Qualified Leads – When deciding what exact metric to plot on the graph, don’t accidentally mix between lead stages. In other words, if your volume metric is raw leads, then the cost metric should be the average cost per raw lead generated and the quality metric should be the conversion rate from raw to marketing qualified (those that became MQL). If instead the volume and cost metrics are for MQL’s, then the quality metric should be the conversion rate from MQL to opportunity.
- Marketing Automation Platforms – What powerful tools these can be (ie – Marketo, Hubspot, etc). Once you can afford one and can hire the right resources to administer, you’ll have a much easier time capturing the data necessary to produce these graphs. Until then, prepare to do manual digging into various systems and spreadsheets.
Summary
This concept of using portfolio theory to optimize your mix of demand generation marketing activities is quite powerful. Use it to get a dialog going and to foster experimentation and refinement but don’t take it to an extreme unless you’ve really got the tools and team to do it.
Related Reading
- 10 Ways to Improve Website Conversion Rates
- Increasing Webinar Attendance
- Improving the Quality of Your Marketing Content